


Latest Releases


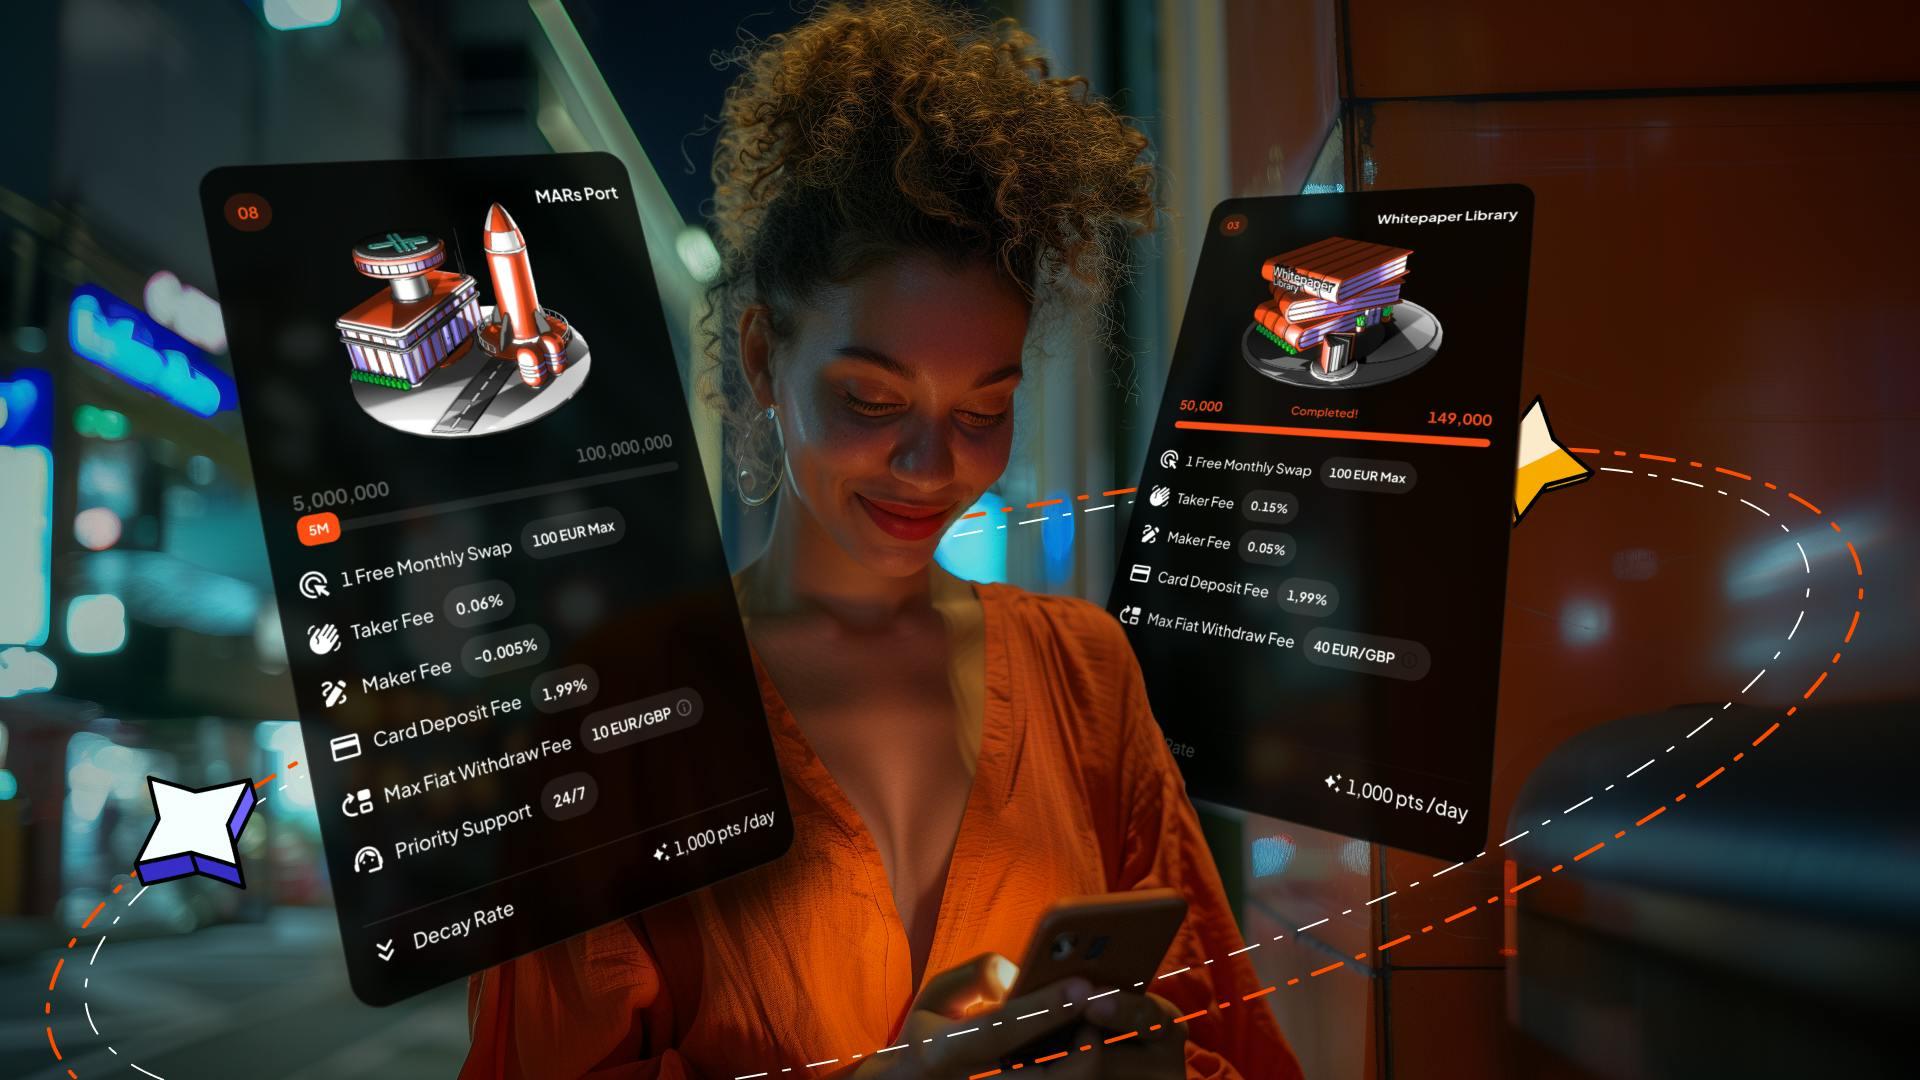
Levels Is Here: Maximize Rewards with Every Trade
As promised, the highly anticipated Levels has arrived! One of crypto’s most fruitful fidelity systems, Levels is crafted to incentivize and reward…
3m

The Future of Programmable Money: Smart Contracts in Finance
Programmable money represents a form of digital currency that can be automatically managed and controlled through software programs known as smart…
8m

Blockchain Voting Systems: Potential and Pitfalls
Essentially, blockchain technology is a system of recording information in a way that makes it difficult or impossible to change, hack, or cheat the…
6m

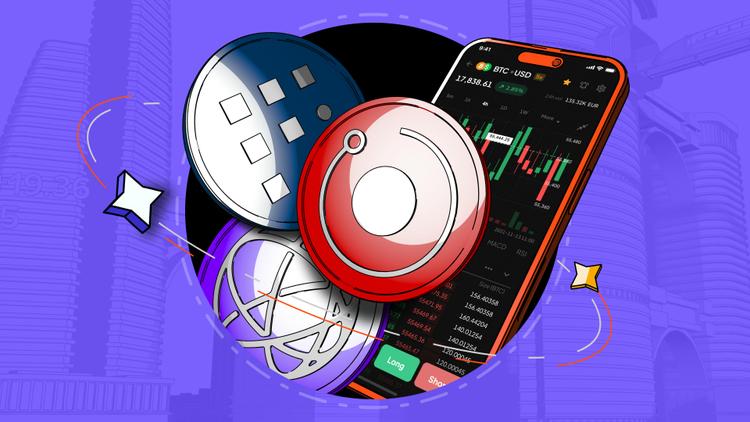
All You Need to Know About Crypto Derivatives
Crypto derivatives are financial contracts that derive their value from underlying cryptocurrency assets. Unlike purchasing Bitcoin or Ethereum…
7m

The Potential of Blockchain Identity Verification and Management
Identity verification has long been affected by challenges such as data breaches, inefficiency, and privacy concerns. Traditional methods often…
5m

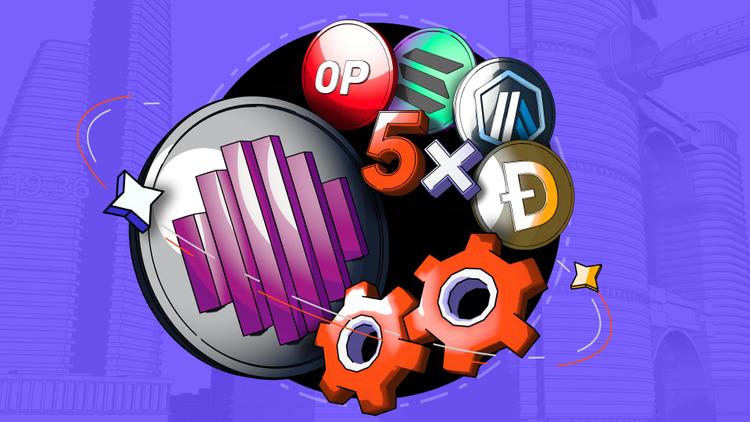
Upcoming Levels Explained: The Rewarding Crypto Journey
Q2 has plenty of reasons to celebrate: In April, Coinmetro is launching Levels, a new system aimed at enhancing the trading experience by introducing…
4m

The Future of Programmable Money: Smart Contracts in Finance
Programmable money represents a form of digital currency that can be automatically managed and controlled through software programs known as smart…
8m
Blockchain Voting Systems: Potential and Pitfalls
Essentially, blockchain technology is a system of recording information in a way that makes it difficult or impossible to change, hack, or cheat the…
6m
All You Need to Know About Crypto Derivatives
Crypto derivatives are financial contracts that derive their value from underlying cryptocurrency assets. Unlike purchasing Bitcoin or Ethereum…
7m
The Potential of Blockchain Identity Verification and Management
Identity verification has long been affected by challenges such as data breaches, inefficiency, and privacy concerns. Traditional methods often…
5m
Upcoming Levels Explained: The Rewarding Crypto Journey
Q2 has plenty of reasons to celebrate: In April, Coinmetro is launching Levels, a new system aimed at enhancing the trading experience by introducing…
4m
Company News
View AllLevels Is Here: Maximize Rewards with Every Trade
As promised, the highly anticipated Levels has arrived! One of crypto’s most fruitful fidelity systems, Levels is crafted to incentivize and reward…
3m
Upcoming Levels Explained: The Rewarding Crypto Journey
Q2 has plenty of reasons to celebrate: In April, Coinmetro is launching Levels, a new system aimed at enhancing the trading experience by introducing…
4m
Product Update, April 2024
We’re breaking the ice on Q2 and we're excited to share the accomplishments of the past month, along with a sneak peek at what's on the horizon. We…
3m
Product Update, March 2024
Welcome to March at Coinmetro! We are rolling out fresh updates and features aimed at optimizing your experience and rewarding your loyalty. Our…
2m

Scheduled Maintenance: Enhancing Coinmetro's Performance
Coinmetro is committed to providing our community with a seamless and secure crypto trading experience. In line with our dedication to excellence, we…
2m

Levels Is Here: Maximize Rewards with Every Trade
As promised, the highly anticipated Levels has arrived! One of crypto’s most fruitful fidelity systems, Levels is crafted to incentivize and reward…
3m
Upcoming Levels Explained: The Rewarding Crypto Journey
Q2 has plenty of reasons to celebrate: In April, Coinmetro is launching Levels, a new system aimed at enhancing the trading experience by introducing…
4m
Blockchain Voting Systems: Potential and Pitfalls
6m
All You Need to Know About Crypto Derivatives
7m
The Potential of Blockchain Identity Verification and Management
5m
Learning Lab
Go to labThe Future of Programmable Money: Smart Contracts in Finance
Programmable money represents a form of digital currency that can be automatically managed and controlled through software programs known as smart…
8m
Blockchain Voting Systems: Potential and Pitfalls
Essentially, blockchain technology is a system of recording information in a way that makes it difficult or impossible to change, hack, or cheat the…
6m
All You Need to Know About Crypto Derivatives
Crypto derivatives are financial contracts that derive their value from underlying cryptocurrency assets. Unlike purchasing Bitcoin or Ethereum…
7m
The Potential of Blockchain Identity Verification and Management
Identity verification has long been affected by challenges such as data breaches, inefficiency, and privacy concerns. Traditional methods often…
5m
The Future of Programmable Money: Smart Contracts in Finance
Programmable money represents a form of digital currency that can be automatically managed and controlled through software programs known as smart…
8m

Blockchain Voting Systems: Potential and Pitfalls
Essentially, blockchain technology is a system of recording information in a way that makes it difficult or impossible to change, hack, or cheat the…
6m

All You Need to Know About Crypto Derivatives
Crypto derivatives are financial contracts that derive their value from underlying cryptocurrency assets. Unlike purchasing Bitcoin or Ethereum…
7m

The Potential of Blockchain Identity Verification and Management
Identity verification has long been affected by challenges such as data breaches, inefficiency, and privacy concerns. Traditional methods often…
5m