Crypto Market Sentiment Indicators: Beyond the Fear and Greed Index
September 14, 2024

by Coinmetro Editorial Team
September 14, 2024
Sentiment indicators play a key role in understanding investor psychology in cryptocurrency markets. These tools assess traders' collective mood, showing if optimism or pessimism dominates. Effective sentiment analysis helps predict price shifts and refine trading strategies.
By understanding investor sentiment, traders can better spot market trends and make wise decisions.
The Fear and Greed Index is a widely used tool for gauging market emotions. It relies on factors like volatility, trading volume, and more to reflect sentiment. While it provides a snapshot of overall sentiment, it has limitations. Other metrics provide deeper perspectives for a fuller picture of sentiment. Social media analysis, on-chain data, and derivatives metrics enhance understanding. These tools together strengthen traders' views of market sentiment. Accurate sentiment analysis supports smarter moves through market cycles.
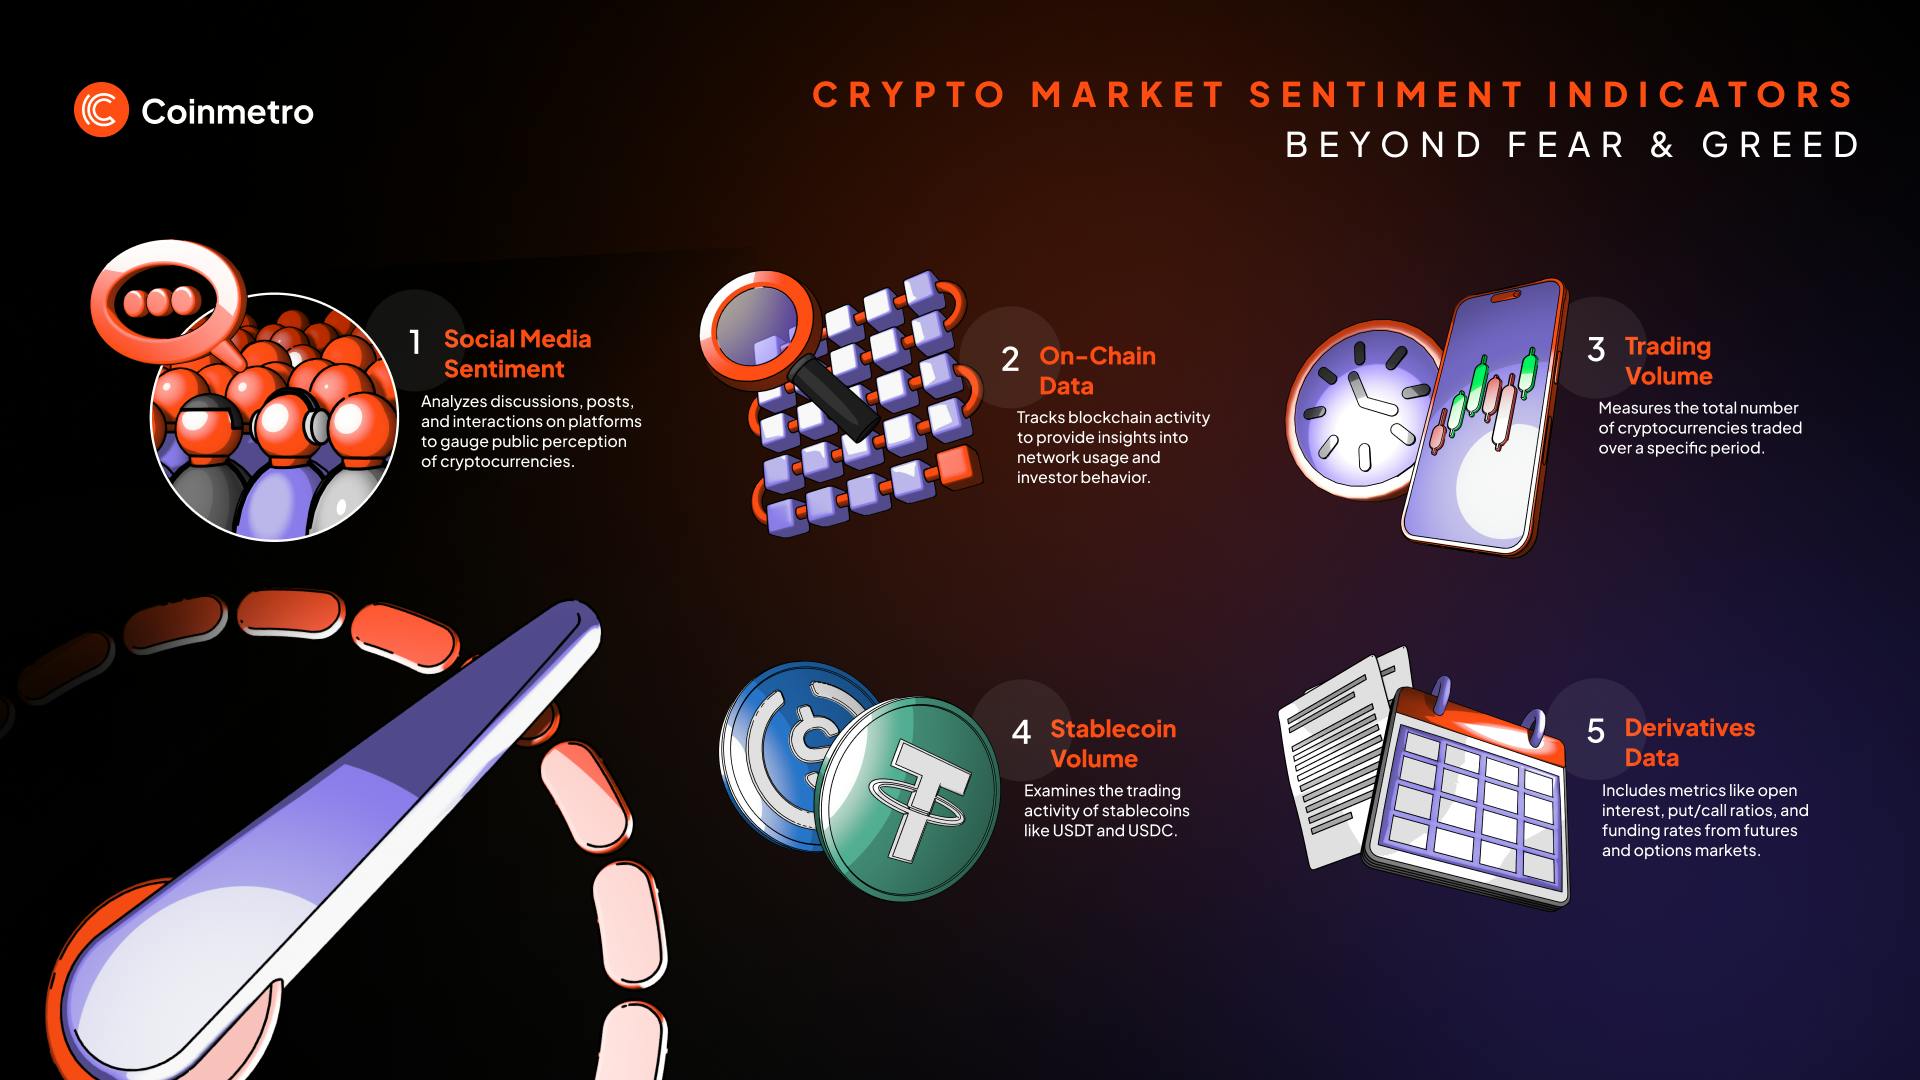
In this blog, you will learn about:
- The Fear and Greed Index in crypto
- Alternative sentiment indicators
- Social media sentiment analysis
- On-chain metrics
- Trading volume analysis
- Google Trends
- Stablecoins volume
- Derivatives data
The Fear and Greed Index for cryptocurrencies measures investor sentiment in the crypto market. It helps gauge whether investors are fearful, which often leads to selling, or greedy, which can trigger buying sprees. This index uses a range of factors specific to the crypto market to determine investors' emotional states.
The Fear and Greed Index in crypto is built from various data points, including:
Volatility: Tracks sudden price swings, often signaling fear during rapid drops.
Market momentum and volume: Measures the overall trading activity, providing insight into whether investors buy or sell aggressively.
Social media trends: Analyzes posts and interactions about cryptocurrencies to gauge the overall sentiment.
Surveys and market dominance: Reviews the dominance of major cryptocurrencies like Bitcoin to understand market shifts.
The index gives a score from 0 to 100. A score near 0 signals extreme fear, often leading to market sell-offs. A score near 100 shows extreme greed, which could lead to overvalued markets and potential corrections. However, the index typically fluctuates between 20 and 80, with extreme readings on either side being less common but still important for signaling significant shifts in market sentiment.
While the Fear and Greed Index helps understand crypto market sentiment, it should not be the only tool used for investment decisions. Crypto markets are highly volatile and can be influenced by external factors like government regulations, hacking incidents, and technological updates. These factors can quickly shift market sentiment, making the index less reliable.
Emotions in crypto shift fast, matching the market’s rapid pace. Relying only on this tool risks hasty choices. Pairing it with fundamental analysis, technical analysis, and current events is vital. These methods provide a broader view of the crypto market. Smart traders blend multiple tools for better decisions.
Discover Crypto Indices: How They Work and Their Impact on the Market
The Fear and Greed Index provides valuable insights into crypto market sentiment. Still, indicators like trading volume and on-chain analytics offer fresh angles. Stablecoin volume, social media sentiment, derivatives, and funding rates show distinct patterns.
Each tool reveals market activity the Fear and Greed Index might not catch. Studying them separately provides investors with a sharper, fuller view of trends. It uncovers drivers of sentiment the index alone misses. This method clarifies network behavior for smarter investment choices. Investors tracking these metrics gain deeper insight into market moods. Details on each indicator follow below.
Social media sentiment analysis tracks user emotions on platforms like X (Twitter) and Reddit. In cryptocurrencies, it offers real-time views of public opinions on coins and trends. This tool can spot sentiment shifts before price changes by analyzing posts and comments.
Algorithms and machine learning process vast online data for sentiment analysis. They scan mentions of cryptocurrencies, keywords, and hashtags across platforms. The system sorts these into positive, negative, or neutral categories.
Monitoring sentiment changes helps traders spot market mood swings early. Analysts use this to predict potential price trends accurately. It provides a clear edge in understanding crypto market dynamics.
X (Twitter): One of the most influential platforms for crypto discussions. With millions of posts related to cryptocurrencies daily, X provides a rich data source for sentiment analysis.
Reddit: Subreddits like r/Cryptocurrency and r/Bitcoin are active hubs for discussions. Analyzing upvotes, comments, and posts can provide insight into the broader crypto community’s sentiment.
Telegram: Although less public than Twitter or Reddit, Telegram groups can offer deep insights into trader behavior and sentiment among smaller, more niche groups.
Sentiment analysis tools: Tools like LunarCrush, CryptoMood, and Santiment aggregate social media sentiment data and present it in an easy-to-understand format for investors.
On-chain metrics pull data from blockchains to reveal cryptocurrency market behavior. Tracking transaction volume and active addresses shows how coins are used and moved. These metrics uncover trends that price movements alone might not reveal.
Transaction volume: Transaction volume measures the total cryptocurrency transferred on the network. High volume signals active trading or asset movement for various reasons. A sudden spike often points to big market shifts like buying or selling.
Active addresses: Active addresses count unique participants in transactions on the network. More active addresses suggest rising interest, adoption, or speculation in a coin. A drop may indicate fading interest or caution among investors.
Understanding on-chain data depends on the context for each metric. Rising transaction volume can show confidence or speculation in a coin. Yet, high volume with falling prices may mean panic selling. Increasing active addresses often signals growing network use and positivity. A decline might reflect lower participation or liquidity in the market. Context shapes what these metrics reveal about trends.
Trading volume plays a crucial role in understanding market sentiment. It represents the total number of coins or tokens traded over a specific period and indicates a cryptocurrency's activity level and interest. High trading volume signals strong investor engagement, while low volume can indicate a lack of interest or indecision.
To analyze trading volume trends effectively, observing how volume changes over time and in relation to price movements is important. Here's how you can interpret different volume trends:
Rising volume during a price increase: Indicates strong buying pressure and positive sentiment. The market shows confidence, and the price rise is likely supported by strong interest.
Rising volume during a price decline: Suggests panic selling or fear among investors. High volume during a downturn may indicate that the market expects further losses.
Falling volume during a price increase: When prices rise on low or decreasing volume, it could indicate a lack of conviction among investors. This often signals that the price movement may not be sustainable.
Falling volume during a price decline: If the price is dropping on low volume, it may suggest that only a small number of traders are selling, and the decline might be temporary.
Real-world examples of trading volume analysis can be seen during sharp corrections in the cryptocurrency market, such as in May 2021, when high volume accompanied a steep drop in Bitcoin prices. The heavy volume reflected widespread panic selling, confirming the negative sentiment in the market.
Google Trends helps traders track public interest in cryptocurrencies through search frequency. A spike in search volume often shows rising curiosity or worry about a coin. This tool aids sentiment analysis by reflecting real-time interest.
Interpreting Google Trends means checking search volumes for terms like 'Bitcoin' or 'Ethereum.' High trading volumes often indicate increasing public interest or market shifts. A sudden spike might hint at price changes from good or bad news.
Context matters since not every spike drives major price action. Combining Google Trends with other indicators clarifies market sentiment better. It offers a sharper view of what drives interest.
In December 2017, 'Bitcoin' searches soared as its price hit a peak. This surge showed mainstream excitement and matched Bitcoin’s climb. In 2021, Dogecoin searches spiked with price jumps from social media hype.
Stablecoins like USDT and USDC are pegged to fiat and stabilize the crypto market. Interpreting their volume needs context and other indicators for a full view. This is because high stablecoin volume can mean both risk avoidance or market entry plans.
During a market downturn: High stablecoin volume with dropping crypto prices shows investors seeking safety. They move funds to stablecoins to avoid volatility. This points to fear in the market.
During market stability or upward trends: Rising stablecoin volume during steady or growing prices suggests trader confidence. Swapping fiat to stablecoins often comes before buying crypto assets. It hints at expected price rises.
Pairing stablecoin volume with price trends and on-chain data can boost accuracy. Social media sentiment also clarifies the market’s mood. This blend sharpens investor understanding.
Options and futures are derivatives that allow traders to speculate on price movements or hedge risk. Options contracts give the right to buy or sell an asset at a set price before a specific date, while futures contracts commit traders to buy or sell at a future date. These contracts generate data like open interest, trading volume, and funding rates, which provide insight into market sentiment.
Derivatives data helps gauge market mood. For example:
Open interest: An increase signals rising participation and growing sentiment.
Put/call ratio: A high ratio (more puts than calls) signals bearish sentiment; a low ratio signals bullishness.
Funding rates: Positive rates indicate bullish sentiment, while negative rates suggest bearishness.
In late 2020 and early 2021, rising open interest and positive funding rates predicted Bitcoin’s bullish surge. Similarly, in May 2021, a rise in the put/call ratio and negative funding rates signaled the market’s bearish turn, aligning with Bitcoin’s price drop.
Relying on just one indicator, like the Fear and Greed Index, may not provide a complete picture of market sentiment. To gain more accurate insights, it's important to use a combination of tools, such as on-chain metrics, trading volume, derivatives data, social media sentiment, Google Trends, and others. Each indicator offers a unique perspective, helping investors understand market movements from different angles.
By combining these data points, traders can reduce the risk of relying on incomplete information. For example, high trading volume might confirm price trends, while derivatives data can provide early warnings of sentiment shifts. Ultimately, using multiple indicators leads to more informed decision-making, helping investors anticipate market trends with greater accuracy.
Discover the Top 5 Bitcoin Indicators: How To Predict BTC Price
Join the Coinmetro community on Discord and Telegram, where forward-thinking traders and investors gather to share insights, explore new opportunities, and dive deep into cryptocurrencies. Should you need any help, please contact our world-class Customer Support Team via 24/7 live chat or email at hello@coinmetro.com.
To become a Coinmetro user today, Sign Up now or head to our new Exchange if you are already registered to experience our premium trading platform.
Tags
Related Articles

Investing, Inflation, and the Erosion of Money: How to Protect Your Wealth in 2026
Inflation refers to the rising cost of goods and services over time. It steadily reduces your money’s purchasing power. For instance, with a 7%…
6m

Regulatory Sandboxes: Fostering Crypto Innovation Within Legal Frameworks
The cryptocurrency industry’s fast rise fuels an important debate. Innovation aims to transform finance, enhancing speed and access. Yet, regulators…
5m

Crypto Options Trading: Strategies and Market Insights
Cryptocurrency markets have rapidly expanded beyond simple buying and selling. One of the most significant developments has been the rise of…
6m

The Rise of Social-Fi: Blending Social Media with Decentralized Finance
In recent years, social media and finance have started to merge, creating Social-Fi. This concept blends the engagement of social platforms with…
6m